Average in Excel
The AVERAGE function is not the only function in Excel for calculating averages, as there are several kinds of averages and each is good for something else. The goal of this guide is to show you specific functions for calculating averages on examples for which they are most suitable. Not every one of us is a mathematician, or has the foundations of statistics, which is why I will try to make these instructions as easy to understand as possible. The instructions assume basic knowledge of creating formulas in Excel.
Average in Excel
All of us surely remember arithmetic average from school. In Excel, we write the AVERAGE function in the following format:
= AVERAGE (data range 1 , data range 2......30)
The data range can be defined by cell coordinates (e.g., A1:A10) or by the name of the identified range (labelled column, row or a dynamically labelled range). There is nothing complicated about averages, so we’ll start with an example right away:
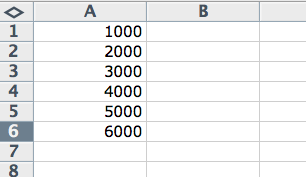
The boss asked us to determine the average income of the store’s customers. Enter the following table with income figures into Excel and save it (we will work with it):

Using Excel’s AVERAGE function, the solution is more than simple. All you have to do is enter the formula in the following format into cell D2, for example:
=AVERAGE(A1:A6)
The function’s result will not surprise anybody:

The average income of the store’s customers is 3,500. We can be satisfied, and the boss as well. But life is not simple enough for the AVERAGE function to be all we need. The average is only used in a data file in which there are minimal differences. The following chapter discusses data files with large differences.
Median in Excel
The MEDIAN function calculates the middle value of the numbers. In Excel, we write it in the following format.
= MEDIAN (data range 1 , data range 2......30)
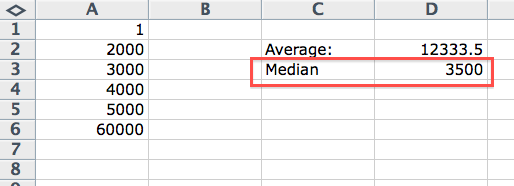
We will best understand the invaluableness of the MEDIAN function on a clear example. The example will be the same as for the AVERAGE function, but the input data will be different (input it according to the picture below):

We changed data in cells A1 and A6. This caused the customers’ average income to go up. The average is now 12,333. If we were to base our business decisions on the average, then we would undoubtedly go bankrupt very soon. The explanation is simple. We set the prices for an “average” customer, but there are only few “average” customers in the group. We are looking at six income figures, but only one is average or higher. Such an approach is bad. We can correct it by using the MEDIAN function. We write it into cell D3 in the following format:
=MEDIAN(A1:A6)
The result of the median is 3,500. Three customers in the group have a higher or same income. Three customers are more than one:

The median value is suddenly the same as the average before the change of the input data. From this we can learn that the median is used for data files that have large differences (that is why we put 1 into cell A1 and 60,000 into cell A6). Statisticians call this the variation range.
Range of variation in Excel
Our data file is short, therefore we were able to estimate the variation range easily. A different situation occurs when there is much more data. In this case it is useful to calculate the variation range. We will need two functions for this:
- MAX function - in the data file finds the cell with the highest value (in our example it will find cell A6 because it has a value of 60,000)
- MIN function - in the data file finds the cell with the lowest value (in our example it will find cell A1 because it has a value of 1)
Writing the MAX and MIN functions is the same as the AVERAGE or MEDIAN functions:
= MAX (data range 1 , data range 2......30)
In cell D4 we enter the MAX function in the following format:
=MAX(A1:A6)
In cell D5 we enter the MIN function in the following format:
=MIN(A1:A6)
And finally we calculate the variation range by simply subtracting the lowest value from the highest one. We write the formula into cell D6.
=D4-D5
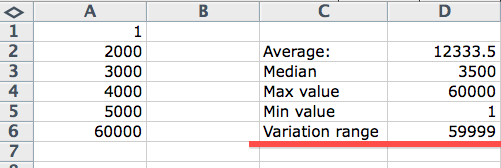
This completes our simple statistical analysis, and it didn’t even hurt. We have all data necessary for our decision on one sheet:

We clearly see what the highest and lowest value in the file is. We also see the variation range, which tells us that there are huge differences in the data file (even taking the lowest and highest value into account). We therefore use the median instead of the average.
© Fotis Fotopulos, 2011
Pictures © Fotis Fotopulos, 2011